How to attract traffic to my website?
Being positioned on the first page of Google is the best way to attract web traffic. 66% of visitors who arrived at a website on the Internet did so through the most famous search engine in the world. How to know the traffic of a web page?
There are different ways to know the traffic that a website receives. From browser extensions (Similar Web), to accounts on free platforms such as Google Search Console or Google Analytics. How can I generate traffic on my blog?
1) Answer the questions and solve the problems that people in your industry have. 2) Use an SEO positioning strategy. 3) Update your content regularly.
Being positioned on the first page of Google is the number one source to drive traffic to your website.
At MozCon 2019 , Rand Fishkin said that by June of that year, 66% of visitors to a website did so through the world’s most popular search engine .
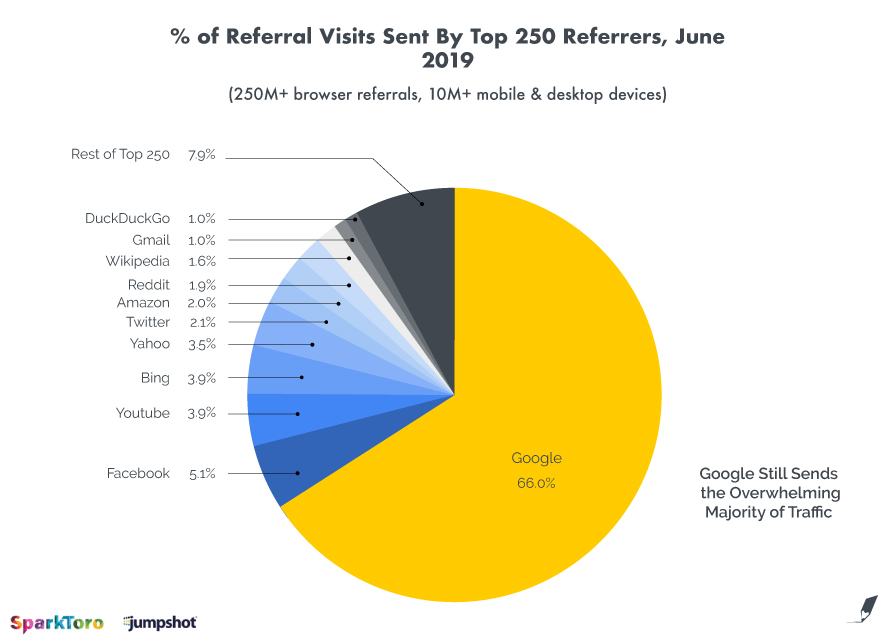
What does this graph tell us ?
That of every 100 visitors who enter a website, only 11 come from the most famous social networks (YouTube, Facebook and Twitter), while 66 come from Google.
Why do we start this blog post with these figures?
Because today many businesses, due to the boom in social networks —especially Instagram— , have turned all their marketing efforts to these platforms and have completely omitted search engine optimization (that is, the positioning of their pages website) .
For this reason, their sites do not receive the expected traffic.
By not receiving the desired number of visits, and not selling enough, business owners attribute the poor results to their company’s digital marketing strategy, planned by the contracted agency at the time.
Clarification :
Everything mentioned above concerns companies whose objective is:
-Generate more visits.
-Get more prospects.
-Close more sales.
-Turn your brand into an industry leader.
It is not the focus of this article to steer businesses away from their social media strategies.
At Pencil Speech we know the power of a good social media strategy and we encourage any emerging organization, or one with years of experience, to use these platforms to add value to their communities.
What can you read in this text?
1.- How to know the traffic (visits) of a website: how many people you are receiving, the type of device they are using, where the people who find you are located, among other statistics.
2.- How to carry out a successful content strategy that generates web traffic and positions you in Google.
3.- The details of the overwhelming advantage that the first page of Google has over social networks when it comes to attracting web traffic.
4.- A case study that analyzes the figures we have achieved in Pencil Speech with our strategy to generate visits on the Internet .
5.- The comparison of how users behave on a website, depending on the way they have reached it (Google vs. social networks).
Let’s get started!
How to know the traffic of a website?
There are different ways to know the traffic that a website receives. From browser extensions ( Similar Web ), to accounts on free platforms such as Google Search Console or Google Analytics .
Let’s see the different benefits and statistics that each tool offers us.
Google Search Console
It is a free service that helps you monitor, maintain, and troubleshoot your website.
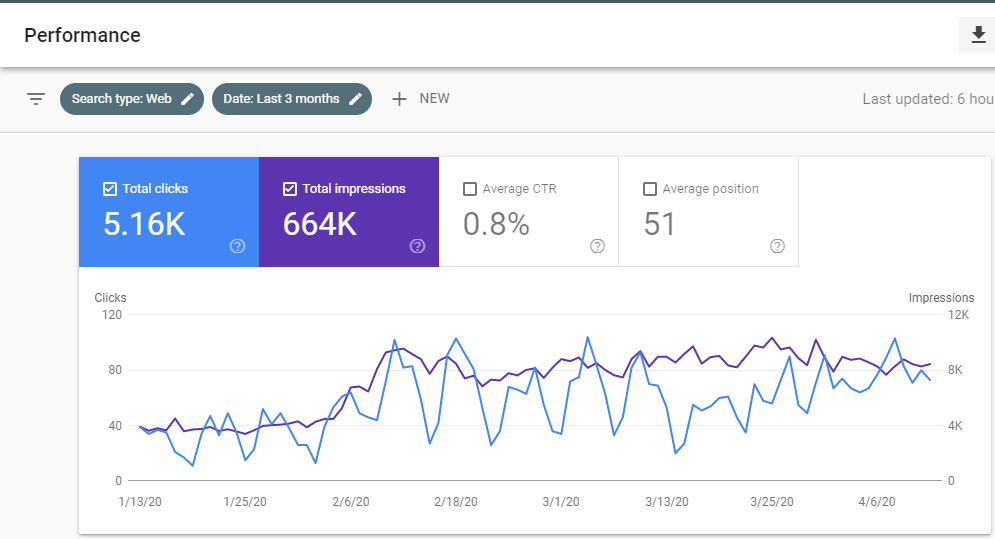
In addition, it allows you to consult the traffic data that your portal receives from the Google results page:
- Frequency (impressions) with which your site appears in the search engine.
- With what queries your pages are shown ( keywords with which they are finding you).
- Number of times users click on your website.
- Average position of your portal in Google results.
These are just the most important stats that the tool grants in terms of performance.
It also gives information about the number of pages indexed in the search engine , the most important errors, mobile loading speed and much more.
All this information allows website owners, or those who manage optimization strategies, to make better business decisions , since they are able to answer questions such as:
- What content should be updated?
- Which articles are attracting more traffic and better converting?
- Which texts should shift their focus to the way ( search intent ) users are searching for that topic on Google?
- In which countries is the portal best positioned?
- What type of device are people using when they come to the website?

Similar website
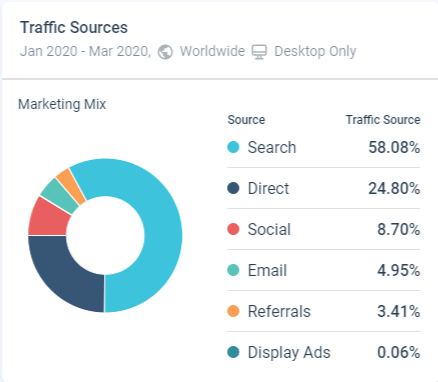
This free Google Chrome browser extension provides a wide range of statistics about the traffic a website receives, not only from Google but from anywhere on the Internet (mail, social networks, direct search).
The only detail is that not all sites provide this data.
If your domain is not receiving a significant number of visitors, you will not be eligible for these statistics.
What data do we know with Similar Web?
1.- Ranking of the site with respect to the world, the country in which it is located and the category in which it competes.

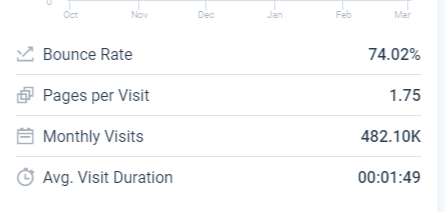
2.- The number of pages seen by the average user, the portal’s bounce rate, the monthly visits received and the time a person spends on the site.
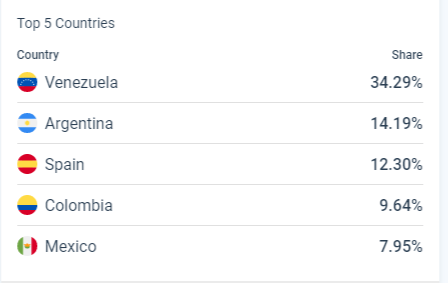
3.- Top 5 of the countries that bring more visitors to the web.
4.- Percentage of traffic that comes from each channel: search engines, references (links), social networks and direct traffic.
How to attract and increase web traffic
We have explained that SEO cannot be sold as a set of codes to implement that will magically increase our web traffic.
The best SEO is the one that is accompanied by the best content production to solve any question and any problem that users may have.
But if you want to fully understand what Content Marketing is, I invite you to click here.
The strategy may seem simple, but it is not simple at all.
SEO strategy and content marketing
a) Grab a pencil and paper.
b) Write down each of the questions that your prospects and clients have asked you since you have been working in your current business.
c) Dedicate yourself to answering these questions as simply and clearly as possible (you can do it yourself, have the support of your team or hire an agency ).
d) Turn those responses into SEO articles and upload them to your website’s blog.
It is VERY important that you are not afraid to talk about the 5 hot spots that every consumer wants to know:
1.- Prices and costs. ( Why you should put your rates on your website and why your fears don’t make sense? )
2.- Main problems of your products or services.
3.- Comparison between your offer and that of your competition.
4.- Criticisms and evaluations of your products and services.
5.- Articles of the style: “The best shoes to play basketball ” (change the words that are in bold according to the theme of your business).
Fulfilling this strategy fully, without a doubt you will increase the web traffic of your business.
Organic positioning in Google vs social networks
In this segment of the article we will reinforce the figures provided by Rand Fishkin at MozCon and detail other studies carried out by different authoritative voices in the industry.
Google is 8.9 times more effective than Facebook (Backlinko)
Let’s start with Brian Dean, founder of Backlinko , who in a Linkedin post to promote his article on techniques to improve your SEO in 2019 , put the following numbers.
1) 57.8% of the traffic received by websites comes from Google.
2) Facebook is the social network that attracts the most visits and barely accumulates 6.5% .
What does this mean?
That when it comes to generating traffic to your website, Google is 8.9 times more effective than Facebook (the best social network in this regard).
Only 5% reach your website from social networks (Bright Edge)
According to Bright Edge :
-51% of traffic to websites comes from organic results on Google.
-10% comes from paid ads on the Google results page.
-5% comes from social networks.
On average, there are 40,000 Google searches every second around the world.
That is, 3.5 billion daily queries.
Therefore, ranking on the first page for a specific search can lead to millions of visitors, thousands of prospects, and hundreds of customers.
Now, what is the abysmal difference between organic positioning (locating your website in the first positions of Google) vs. attract visits from social networks?
Algorithm in social networks 2020
To begin with, there are at least a couple of reasons:
1.- In social networks, the engagement and organic reach of posts that contain links are very low. People pay very little attention to what is beyond the post they are looking at at the moment.
2.- Every day that passes, the algorithms of the platforms are focused on showing you exactly the content that you like the most and the one that will keep you the longest inside ( and not outside ) the network.
Ask yourself the following questions:
How many times have you clicked on a link in a tweet ?
And in the link of a Facebook post?
How many times have you swiped up on Instagram?
You have probably given thousands of likes , commented on hundreds of photos and shared dozens of publications, but how many times have you left one of these platforms to read an article on a website?
The number, in relation to the other actions, is surely much lower.
So, what are, for sure, the engagement figures in the various social networks?
Rand Fishkin, at MozCon (2019), presented the following figures, corresponding to the average of all industries:
Facebook: 0.09% per post. That is, 1 in 1,000 people interacts with the publication that appears in front of them.
Twitter : 0.048% per post. That is, 1 in 2,000 people interacts with the publication that appears in front of them.
Instagram : 1.73% per post. That is, 2 out of 100 people interact with the publication that appears in front of them.
As you can see, these are surprisingly low numbers.
An individual can follow more than 1,000 users on Instagram or Twitter, but only see the same 100 accounts on a daily basis, at most.
For example:
The famous Venezuelan singer Nacho (@nacho) has 11.9 million followers on his Instagram account.
In a post he made on July 29, 2019, he only got 107,312 likes and about 1,500 comments.

This is 0.9% likes and 0.01% comments regarding their followers (figures that support the above).
Now, why do we always see the same accounts on social networks?
Because its algorithm knows that these are the users that will keep us on the platform.
As we said in this point two, it is not exactly the goal of networks to be used as a bridge to reach websites.
Their reason for being is that you spend more time inside than outside them.
Google, on the contrary, was built with the idea of connecting all the knowledge of civilization to offer millions of answers in tenths of a second.
This, however, has been changing in recent times.
Google is mutating: it is no longer just a bridge, it is also a destination
Let’s talk a little about this last point:
How come Google is no longer the bridge to the websites that answer questions and solve user problems?
Yes, unfortunately this is happening.
Google is becoming a destination , when before it was only a transit terminal .
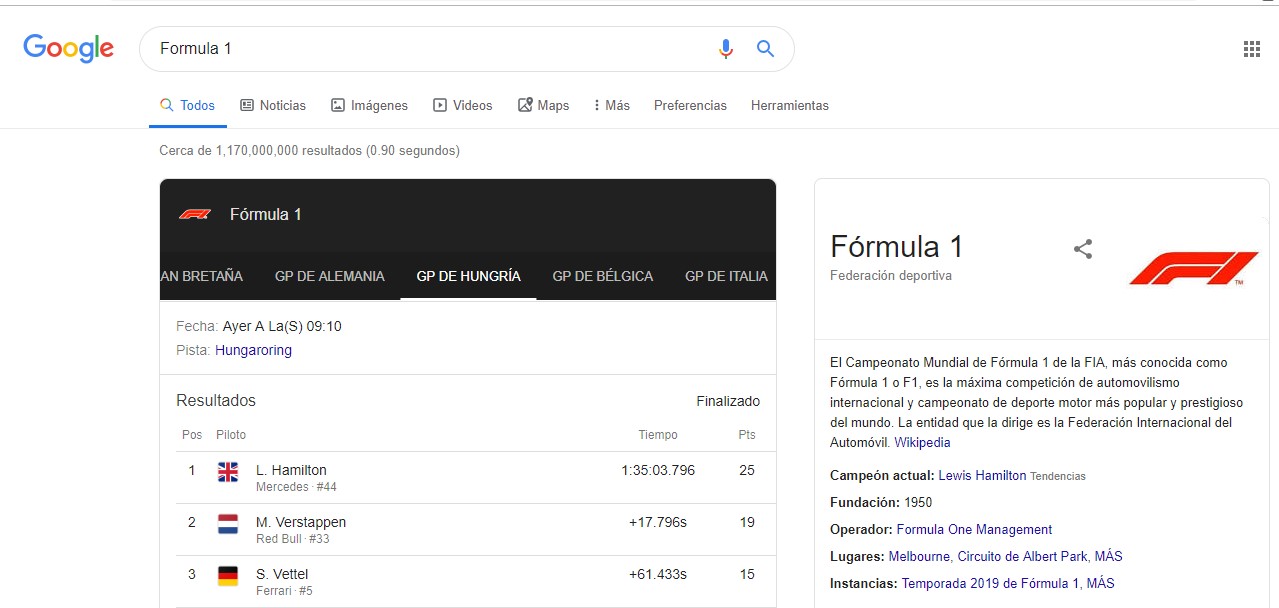
According to SparkToro , as of September 2019, 56.10% of searches performed on Google did not result in clicks .
That is, the user made a query and then did not enter any website.
Why is this happening?
Because Google is providing information to users directly on the results page, without the need for them to navigate to other sites.
Does this situation affect content creators and brands that want to position themselves on Google?
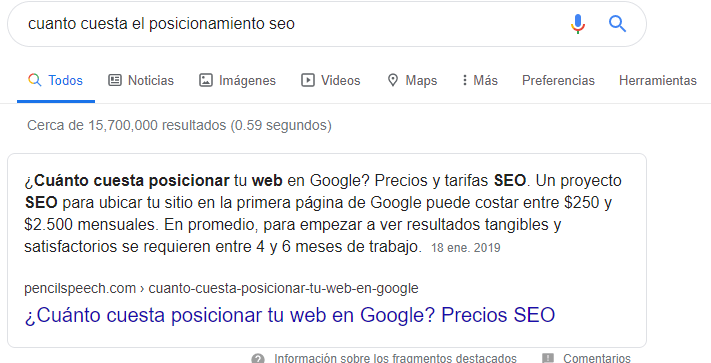
Yes, but it also gives companies opportunities to create brand awareness through featured snippets ( explanation ).
Has Google gotten into trouble for using content from other sites and presenting it as their own?
Again, yes, but analyzing all this complex situation is not the objective of this article.
Therefore, let’s continue.
Case Study: Pencil Speech Web Traffic (Google vs. Social Media)
We have already placed all the major studies and we have analyzed the data provided by the most relevant voices in the industry.
Now, let’s see a case study.
This time, the laboratory mouse will be our own website:
At Pencil Speech we have published 20 articles on our blog to date.
In addition to these contents, we must take into account:
-The subtitles that rank as separate articles.

– The main pages of our website.

-Pencil images that have been indexed by Google.
-The 16 videos that we have on YouTube (which are also archived by Google and allow us to have more visibility in the search engine).

With everything mentioned above, you can think:
“It is obvious that you have generated more traffic from Google, all your efforts are focused there.”
The truth is that no: in our team we have always had a global vision of marketing.
Although we specialize in SEO, our intention is to be recognized as a brand that likes to learn and discuss any marketing topic.
For this reason, we wanted to generate a positive experience on each platform we are on.
With this goal in mind, we implemented a strategy called content on content , created by Gary Vaynerchuk .
The content on content strategy is based on recording (in audio or video) long pieces of content (talks, podcasts, work sessions) and dividing them into mini publications that will be distributed through various channels (social networks).
For example, a single lecture by a Pencil Speech member can result in:
– Various videos for Instagram.
-An article for the web.
-The talk in audio format.
Thanks to this modus operandi we have distributed, between different platforms, the following number of contents (from 04/16/2019 to 08/06/2019):
– Facebook : 27 publications (16 of them with links to the web).
– Linkedin : 28 publications (17 of them with links to the web).

– Instagram : 39 publications (11 of them with links to the web).
Note: As we do not have the necessary number of followers, we do not put links in stories yet. Therefore, the links have been posted in the profile biography.

Let’s see, we have been active in our networks.
We have delivered content and engaged with our community.
Basically, we have had a lot of fun and we are happy with our results, because the work that the RRSS have done has been framed in the objectives that we set for them :
-Brand recognition.
-Exposition.
-Followers.
-Interaction with other companies.
-Community development.
Now, have we gotten traffic to our site through them?
Let’s see.
Acquired web traffic figures (Pencil Speech case) – 2019
According to Google Analytics, and taking into account all channels, our website (from January 18 to July 31, 2019) has attracted the following traffic:
Usuarios Usuarios nuevos Sesiones Bounce rate Páginas vistas por sesión Duración promedio de la sesión
2.528 2.493 3.641 69.71% 1.97 0:02:48
2,493 new users have visited us in 6 months .
That equates, on average, to 416 new users every 30 days .
While 290 new users came to the web from February to April , in the month of July alone the site received 771 new users , nearly double the average that we mentioned in the previous paragraph.
Why is this happening?
The number of articles published is a factor, of course. In March there were not the same number of articles published as in July.
However, there is another super important aspect: the authority of our website .
As time goes by, Pencil Speech gains the trust of Google, who little by little recognizes us as a source specialized in SEO.
As we have explained before, web positioning works as follows:
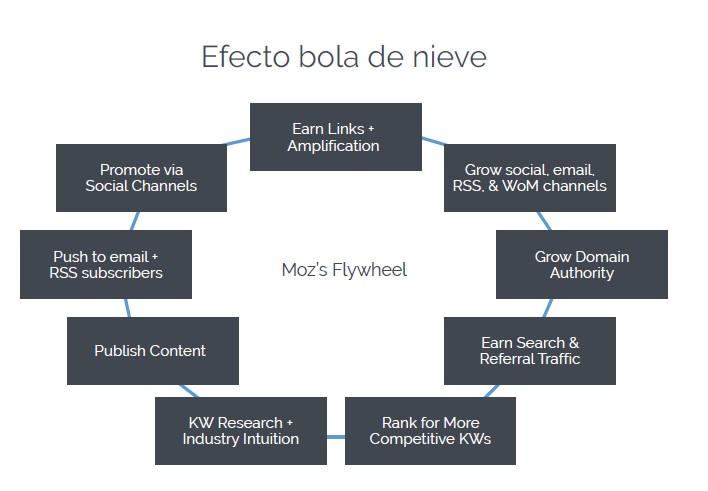
1) We publish content.
2) We promote it by mail and social networks.
3) We gain links and amplification because other people mention us on their websites and on their Twitter, Facebook and Instagram accounts.
4) We grow in subscribers and followers.
5) As more people come to our content and spend more time there, Google rewards us by giving us a vote of confidence that increases our authority in the industry.
6) By having more authority, we can win better positions in the search engine.
7) As we are able to reach privileged positions, we rank for more competitive phrases.
8) So, we do a keyword search and this time we target those that generate even more traffic.
Now, how are those Pencil Speech visits divided? What channels did users come from?
Let’s watch.
Traffic acquired by Google (organic searches)
The Pencil Speech website received the following traffic from the Google results page (from 01/18/2019 to 07/31/2019):
| Usuarios | Usuarios nuevos |
|---|---|
| 1.555 | 1.538 |
The 1,538 users obtained from Google represent 61.7% of the web traffic attracted from January to July.
Traffic acquired by Social Networks
The Pencil Speech website received the following traffic from these platforms:
| Red social | Usuarios | Nuevos usuarios |
|---|---|---|
| 63 | 62 | |
| YouTube | 54 | 52 |
| 46 | 45 | |
| 18 | 16 | |
| Quora | 16 | 16 |
| 1 | 0 | |
| 198 | 191 |
The 191 users who came to our website from different social networks represent just 7.7% of the audience.
Again, we can see that our own figures agree with the studies carried out by the large companies in the SEO industry mentioned at the beginning of this article.
Now that we know where more traffic comes to our website, let’s see how users behaved depending on the channel through which they arrived.
User behavior
Does the channel through which users arrive affect their behavior within a website?
Do people who come from Google last longer in the portals than those who enter from social networks?
What type of user sees more pages on average?
Let’s answer these questions!
Performance of users attracted from Google
| Usuarios | Usuarios nuevos | Sesiones | Bounce rate | Páginas vistas por sesión | Duración promedio de la sesión |
|---|---|---|---|---|---|
| 1.555 | 1.538 | 2.320 | 72.63% | 1.92 | 0:02:52 |
Performance of users attracted from social networks
| Usuarios | Usuarios nuevos | Sesiones | Bounce rate | Páginas vistas por sesión | Duración promedio de la sesión |
|---|---|---|---|---|---|
| 198 | 191 | 244 | 74.59% | 1.84 | 0:01:34 |
If you look closely, the pageviews per session are slightly higher for users arriving from Google ( 1.92 vs 1.84 ).
While the bounce rate is higher when the user arrives from a social platform (74.59% vs 72.63%).
What is the bounce rate ?
It is the percentage of users who enter one of your pages and then close the tab, without navigating any further within your website.
In other words, the bounce rate is determined by the number of people who, during their visit, only saw one section of the portal.
Now, the most important difference is in the average duration time per session:
– 2 minutes 52 seconds for users arriving from Google.
– 1 minute and 34 seconds for users arriving from social networks.
What can be caused this?
As we have explained in previous articles and videos, SEO is the only marketing tool that allows you to appear in front of your users right at the moment when they are looking for something related to your product or service.
Therefore, those who arrive from Google are much more likely to be more interested, more curious and closer to buying your product or service than the people who land on your website from social networks.
Conclution
The main recommendation is the following: all those companies, freelancers or agencies that have a website should bet on Google and SEO as their main strategy to attract web traffic.
Clearly, we all have different marketing goals, budgets, brands, and ways of working.
However, what is certain is that the largest volume of users is found in the most famous search engine in the world. So, when wondering why nobody comes to our site, remember that the answer is here.

The big question now is: How to get to the first page of Google?


